
The Risk-Intelligent Balance Sheet
How Continuous Structural Intelligence Is Reshaping Commercial Property Underwriting, Reinsurance, and Operational Resilience
A strategic analysis for insurers, reinsurers, and enterprise infrastructure operators
Executive Summary
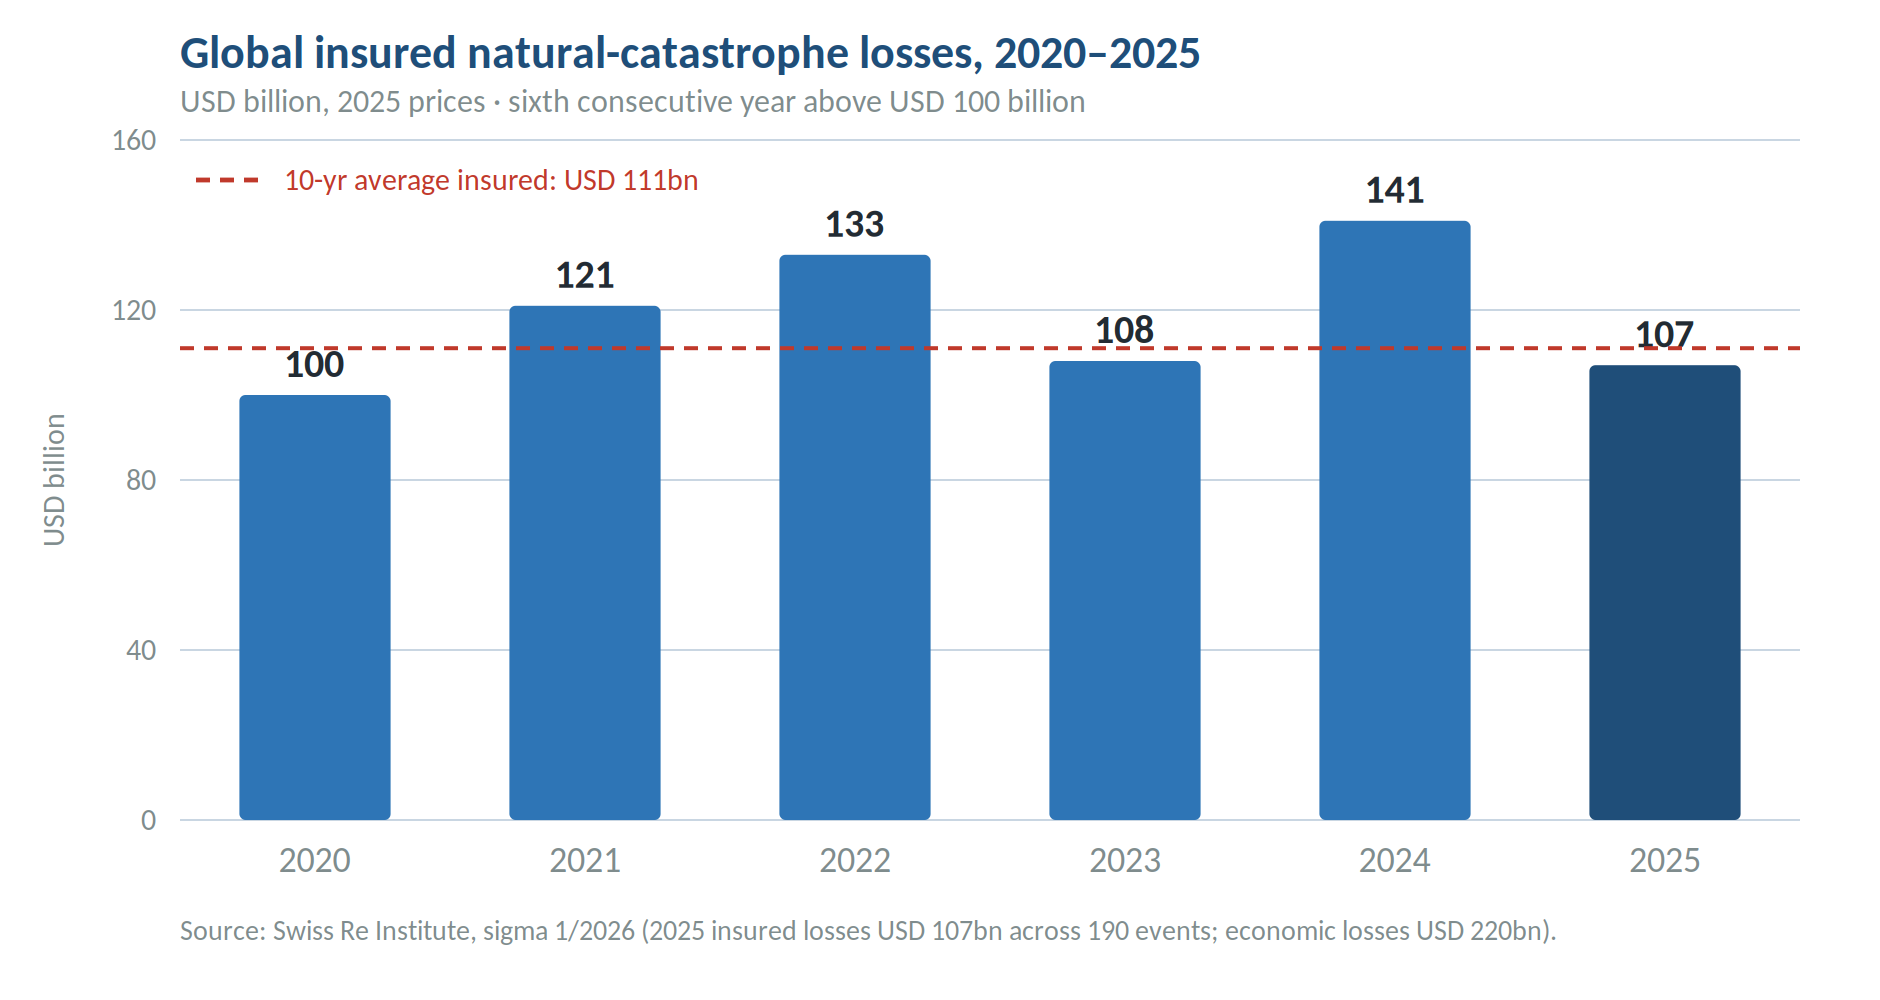
Commercial property insurance is being pressured from two directions at once. Catastrophe exposure continues to rise structurally, even in years when losses fall below trend, while the data on which buildings are priced remains episodic, subjective, and often years out of date. According to the Swiss Re Institute, global insured losses from natural catastrophes reached USD 107 billion in 2025 across roughly 190 events — the sixth consecutive year above USD 100 billion — against total economic losses of USD 220 billion, of which only about half were insured (sigma 1/2026). The Institute is explicit that the below-trend insured total reflected favorable annual variability rather than any easing of underlying risk, and that exposure growth alone explains more than 80 percent of the long-term rise in weather-related insured losses since 1970.
This paper argues that the most consequential response available to insurers is not a new model parameter but a new data class: continuous, objective, structure-level condition data. When a building is instrumented with a small number of wireless sensors and an AI analytics layer, it stops being a static line on a schedule of values and becomes a continuously scored asset. That score — expressed here as a Structural Condition Index (SCI) on a 0–100 scale, banded into Healthy, Watch, and At Risk — functions as the equivalent of a credit score for a building: a single, comparable indicator standing in for an expensive, intermittent, and subjective assessment.
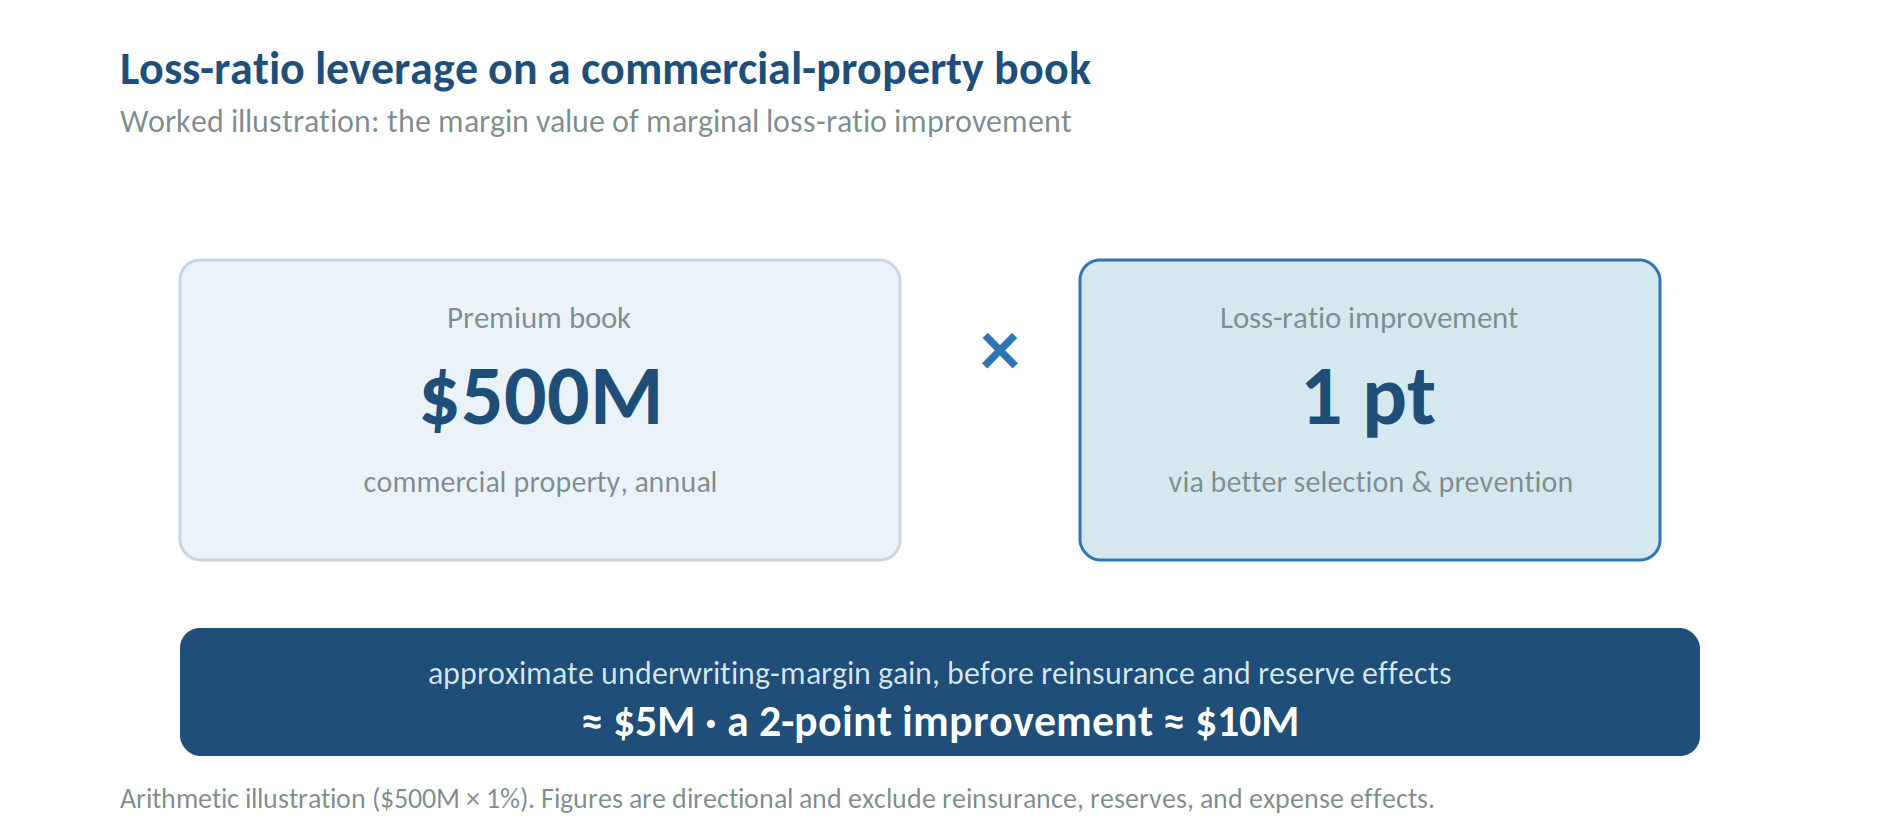
The financial logic follows directly. On a USD 500 million commercial property book, a single percentage point of loss-ratio improvement is worth roughly USD 5 million of underwriting margin before reinsurance and reserve effects — a level of leverage that makes even modest gains in risk selection and loss prevention material. Continuous condition data supports that improvement in four ways: sharper risk selection at bind and renewal; faster, cheaper, less disputed claims through event-verified data; condition-based rather than calendar-based inspection that redirects engineering resources to the assets that warrant them; and entirely new product structures, including parametric triggers that fire on verified structural response rather than on adjuster interpretation.
For seismic-exposed portfolios in particular, the case is concrete. Japan’s exposure runs from the Great East Japan (Tohoku) earthquake of 2011, with economic losses on the order of JPY 16.9 trillion (roughly USD 118 billion), to the Noto Peninsula earthquake of January 2024, which generated multi-billion-dollar economic losses and ranked among the costliest insured earthquake events in the country’s history. In dense urban markets, the binding constraint after an event is rarely capital; it is information — specifically, the weeks it takes to determine which buildings are safe to re-occupy. Continuous monitoring compresses that timeline from weeks to hours, directly attacking business-interruption cost, which frequently exceeds physical damage.
The transition is evolutionary, not disruptive. Continuous structural intelligence is an additive layer that integrates with existing underwriting, catastrophe, asset-management, and BIM systems rather than replacing them; it is delivered as a managed service on a 12–18 month pilot path that requires no client IT infrastructure. The strategic question for carriers and reinsurers is therefore one of timing. The market transition is already underway, and the organizations that build structural-condition data into underwriting, reserving, and treaty design first will hold a durable advantage in risk selection and capital efficiency over those that continue to price the built environment from historical proxies.
Rising Infrastructure Risk Exposure
The assets that commercial property insurers underwrite are aging while the hazards acting on them intensify. In the United States, the American Society of Civil Engineers assigned the nation’s infrastructure an overall grade of C in its 2025 Report Card — the highest mark since the assessment began in 1998, and an improvement over the C− of 2021, yet still a grade that signals systemic deferred maintenance. Bridges held at a C, with roughly 6.8 percent of the country’s more than 623,000 spans rated in poor condition, and ASCE estimated a multi-trillion-dollar gap between the investment planned through 2030 and the investment actually required. The built environment that carriers insure is, in aggregate, older and more fragile than the schedules of values on which it is priced suggest.
The deeper problem is informational. A schedule of values captures a building at a moment — its age, construction type, occupancy, and replacement cost — and then assumes those attributes adequately describe its risk until the next inspection or renewal. But structural condition is dynamic. Materials fatigue, foundations settle, joints loosen, and a single seismic or wind event can change a structure’s behavior in ways that are invisible from the street and undetectable by a periodic visual survey. Two of the defining structural failures of the past decade — the 2018 Morandi Bridge collapse in Genoa and the 2021 Champlain Towers South collapse in Surfside, Florida — occurred in assets under conventional inspection regimes, where progressive deterioration was either not surfaced or not acted upon in time.
The built environment that carriers insure is, in aggregate, older and more fragile than the schedules of values on which it is priced suggest.
For insurers, this is not an abstract engineering concern. The gap between an asset’s assumed condition and its actual condition is, in effect, an unpriced risk sitting inside every portfolio. It manifests as adverse loss development, as disputed claims where causation and timing are contested, and as the business-interruption exposure created when a damaged but standing building cannot be cleared for occupancy quickly. Closing that gap requires moving the unit of analysis from the policy record to the physical structure itself — and observing it continuously rather than episodically.
Insurance Industry Pressures
Commercial property carriers operate on thin and volatile margins, which is precisely what makes condition data financially compelling. Loss ratios are the dominant lever in property underwriting economics, and they are sensitive to small changes in risk selection and loss prevention. The arithmetic is unforgiving but also clarifying: on a USD 500 million book, each percentage point of sustained loss-ratio improvement converts to approximately USD 5 million of underwriting margin before reinsurance and reserve effects, and a two-point improvement to roughly USD 10 million.
Improvements of that magnitude do not require a technological revolution in every account. They require systematically avoiding the worst risks at bind, identifying deteriorating risks before renewal, and engaging policyholders in maintenance that prevents losses rather than paying for them afterward. Each of these depends on knowing the current condition of the structure — not its condition at the last inspection, and not the average condition of its construction class. Continuous monitoring is the mechanism that makes condition observable at portfolio scale and at a cost that is a small fraction of the margin it protects.
A second pressure is competitive. As reinsurance capacity and pricing cycle, primary carriers are under constant pressure to win and retain quality business without under-pricing it. Telematics demonstrated in personal auto that objective, continuous behavioral data lets an insurer simultaneously offer better terms to good risks and price adequately for poor ones — improving both growth and profitability. Structural condition data offers the property market an analogous capability: a defensible, asset-specific basis on which to differentiate resilient buildings from superficially similar but more fragile ones.
Climate and Catastrophic Loss Trends
The catastrophe loss record of recent years makes the exposure trend unmistakable. Insured natural-catastrophe losses have now exceeded USD 100 billion for six consecutive years, reaching USD 107 billion in 2025 after USD 141 billion in 2024 (Swiss Re Institute, sigma 1/2026). The headline 2025 figure was below the long-term trend line, but the Institute attributed that to favorable variability rather than reduced risk, noting that the next major peak-peril year will land on a larger and more valuable exposure base. Severe convective storms alone contributed roughly USD 50 billion of insured loss in 2025 — its third-costliest year on record — and the Los Angeles wildfires became the largest insured wildfire event in the sigma series at around USD 40 billion.
For a Japanese-anchored portfolio, the seismic record is the more relevant frame. The Great East Japan (Tohoku) earthquake and tsunami of 2011 produced economic losses on the order of JPY 16.9 trillion — roughly USD 118 billion — and reset the baseline for catastrophic seismic exposure in a mature insurance market. More recently, the magnitude-7.6 Noto Peninsula earthquake of 1 January 2024 caused widespread damage across Ishikawa and neighboring prefectures; government estimates placed economic losses in the range of JPY 1.1–2.6 trillion, and the General Insurance Association of Japan reported paid claims approaching JPY 91 billion within months, ranking it among the costliest insured earthquakes in the country’s history. Notably, much of Japan’s residential earthquake exposure is borne by a government-backed scheme and a large share of corporate earthquake risk is ceded to reinsurers — which means structural-condition data has direct relevance to cedant differentiation and treaty design, not only to primary pricing.
The next major peak-peril year will land on a larger and more valuable exposure base than the last — which is why the quality of asset-level data, not just the quantity of capital, increasingly determines who absorbs the loss well.
The strategic implication is that catastrophe modeling, however sophisticated, is only as good as the asset data it ingests. Models that represent a building through its year built, construction class, and seismic zone are estimating fragility from population averages. A continuously monitored building contributes its own measured response — how it actually behaved under prior ground motion or wind loading — converting an assumption into an observation and tightening the loss distribution that drives both pricing and reserving.
Infrastructure Intelligence as a Financial Asset
The central reframing of this paper is that continuous structural data is not an operational cost line; it is a financial asset that accrues to whoever holds it. For the building owner, a defensible record of structural condition supports refinancing, capital planning, and disposition; for the insurer, it sharpens pricing and reserving; for the reinsurer, it improves the quality of the portfolios it assumes. The same data stream creates value at every tier of the risk-transfer chain.
That value rests on three properties of well-designed monitoring. First, the data is objective and time-stamped, which is what makes it usable in pricing, in claims, and in dispute resolution. Second, it is continuous, so it captures both slow-developing deterioration and the discrete impact of an event. Third, it is comparable across assets through a normalized index, which is what allows it to be aggregated to portfolio and treaty level rather than remaining trapped in asset-by-asset engineering reports. The Structural Condition Index is the concrete expression of that third property: a single 0–100 score that lets a fragility-curve-grade understanding of one building be benchmarked against thousands of others.
The minimal-sensor, AI-modeled architecture
The economics that make this a financial asset rather than a research project rest on a specific architecture:
- Approximately 3–5 wireless sensors per building — typically base, mid-height, and roof — rather than the dense wired arrays of legacy SHM. AI-assisted inferential modeling extends coverage to locations beyond where sensors are physically installed.
- Edge AI filtering on or near the device, separating genuine structural response from ambient noise so that only decision-relevant events are escalated — avoiding the alert fatigue that has historically deterred insurers from on-site hardware.
- Integration, not replacement: the analytics layer feeds existing underwriting, catastrophe, asset-management (CMMS), and BIM/digital-twin systems through APIs rather than displacing them.
- Managed-service delivery on an operating-expense basis, requiring no client IT infrastructure, with a 12–18 month pilot path to evidence value before portfolio-scale rollout.
Framed this way, the adoption decision is not whether to buy a monitoring product but whether to begin building a proprietary, compounding data asset — one whose value increases as more of a portfolio is instrumented and as longer baselines make anomaly detection and trend forecasting more reliable. The carrier that starts earlier accumulates a longer and more valuable record.
Dynamic Underwriting Models
Conventional commercial property underwriting is backward-looking by construction. It prices an account from a schedule of values fixed at bind, supplemented by inspections conducted annually or less often and by historical loss experience. Between those touch-points the insurer is effectively blind: the risk is assumed to be static even though the asset is not. Renewal repricing then corrects course using information that is, by definition, already stale.
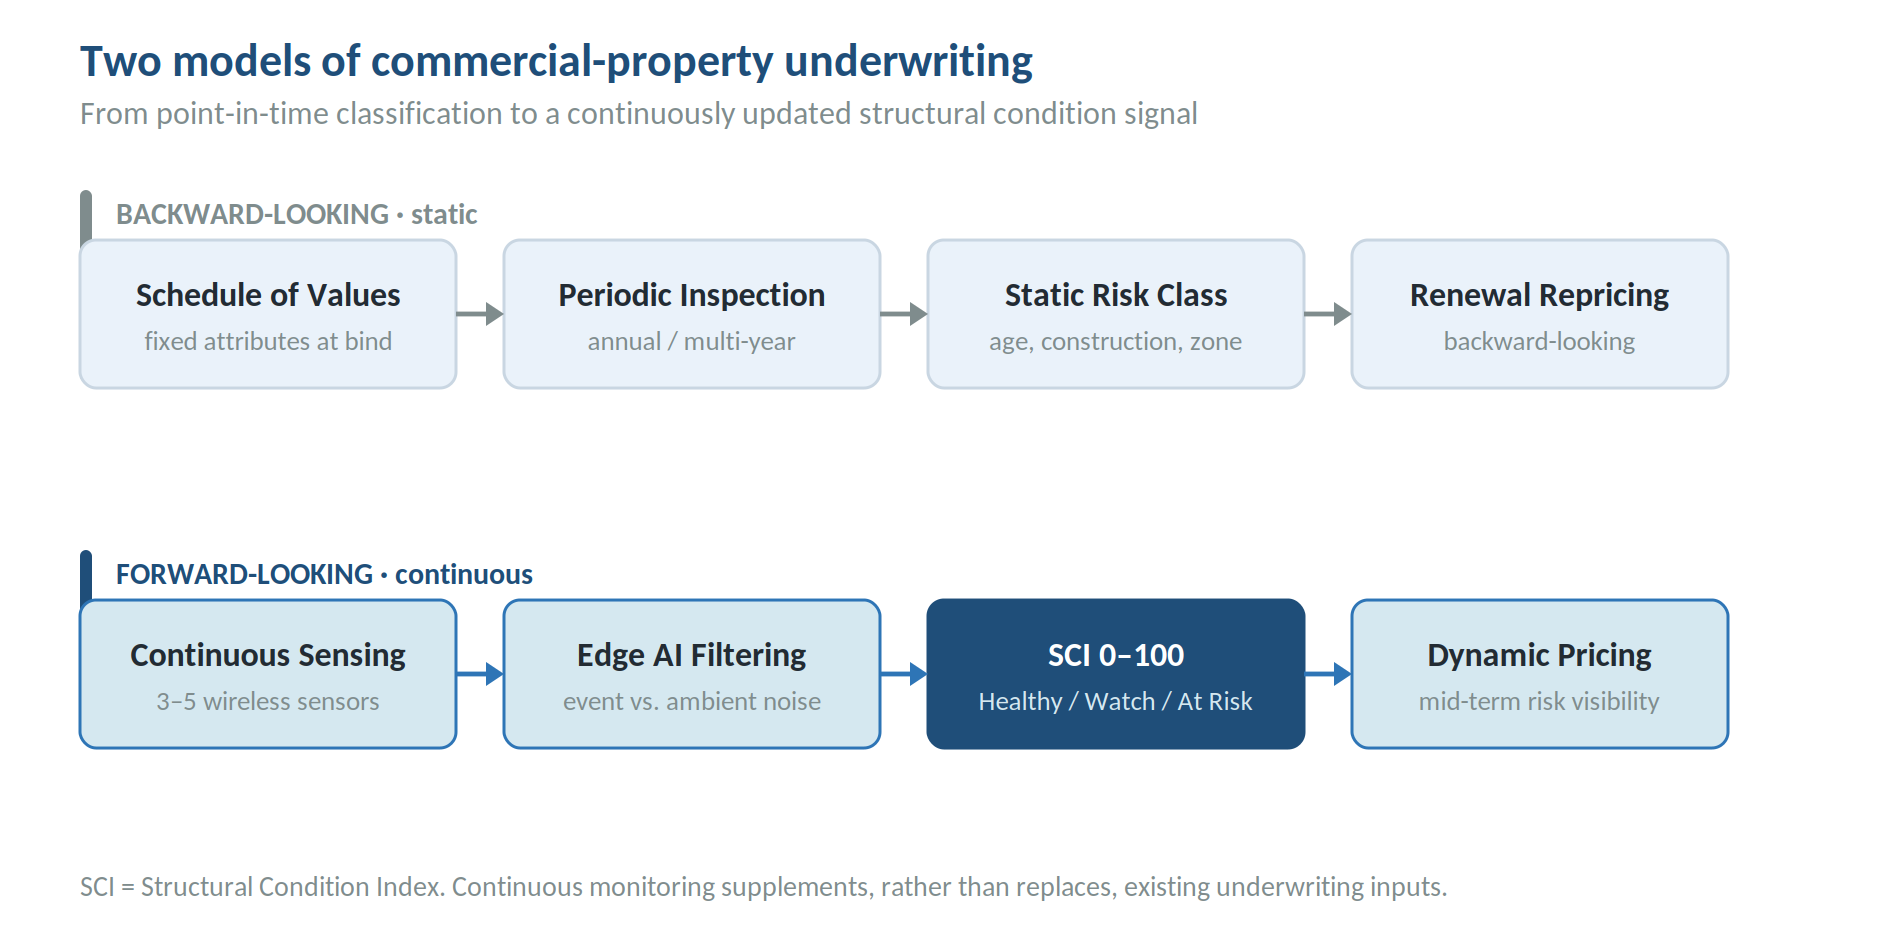
A forward-looking model inverts this. Continuous sensing feeds an edge-filtered analytics layer that maintains a live Structural Condition Index for each insured asset. Underwriters and risk engineers gain mid-term visibility into how a structure is actually performing, not merely how its class is expected to perform. Pricing can then reflect demonstrated resilience: buildings whose measured response indicates stable stiffness and well-behaved dynamics warrant more favorable terms than superficially identical structures showing concerning trends, and accounts drifting toward the Watch or At Risk bands can be engaged before — rather than after — a loss.
Two design principles keep this credible to underwriters. The first is that continuous data supplements existing inputs rather than replacing actuarial and catastrophe-model judgment; the SCI is an additional, high-resolution signal, not a substitute for the rating plan. The second is that the signal must be decision-ready. Underwriters do not want raw vibration traces; they want a banded score, a trend, and an alert when a threshold is crossed. Delivering intelligence rather than telemetry is what makes structural data usable inside an underwriting workflow rather than another data silo requiring manual reconciliation.
Portfolio-Level Structural Risk Analytics
The value of a normalized condition score compounds when it is aggregated. A single SCI tells an underwriter about one building; a distribution of SCIs across a book tells a chief underwriting officer where the portfolio’s structural risk is concentrated, how it is trending, and where finite risk-engineering resources should be directed. This is the shift from asset-level monitoring to portfolio-level risk analytics.
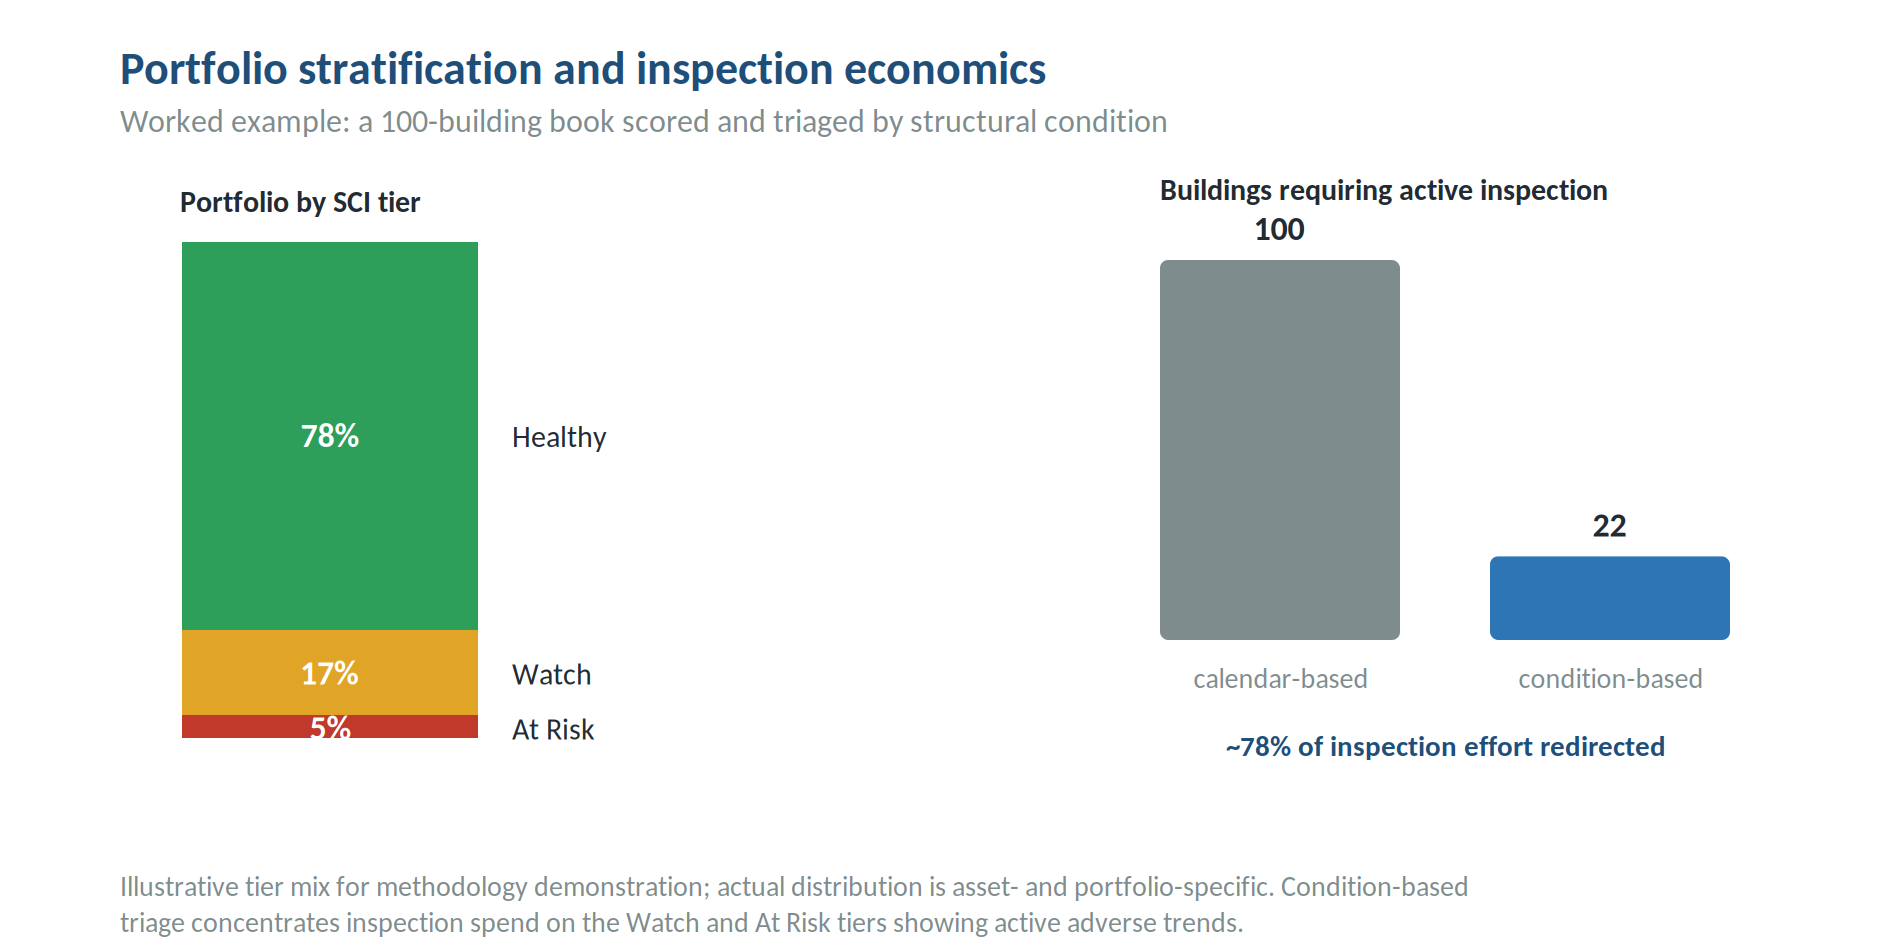
Consider a stylized 100-building book triaged by condition. The large majority of well-maintained assets sit in the Healthy band and require no active intervention; a smaller cohort in the Watch band warrants targeted engagement; and a small At Risk cohort justifies priority inspection and, potentially, repricing or remediation requirements at renewal. Under a calendar-based regime, all hundred buildings are inspected on a fixed cycle regardless of condition. Under a condition-based regime, inspection effort concentrates on the buildings actually showing adverse trends — redirecting the large share of inspection spend that calendar-based programs expend on assets that turn out to be fine.
This reallocation is where continuous SHM reduces cost rather than adding it. Inspection campaigns, forensic investigations, and engineering mobilizations are expensive and slow; a portfolio that knows which assets need attention can spend its risk-engineering budget where it changes outcomes. The same stratification supports accumulation management and ESG reporting, giving the carrier a defensible, quantitative view of the structural resilience embedded in its book rather than a qualitative assertion.
AI Risk Scoring Systems
The organizing concept beneath all of the above is structural risk scoring: the continuous synthesis of sensor data, AI modeling, trend analysis, and environmental and seismic correlation into a single, comparable indicator of an asset’s condition and trajectory. The Structural Condition Index expresses this on a 0–100 scale, banded into Healthy, Watch, and At Risk, and paired with fragility curves that express the probability of damage at given future loading levels — making the score forward-looking rather than merely descriptive.
A continuously updated structural score functions as the equivalent of a credit score for a building: a single comparable indicator standing in for an expensive, intermittent, and subjective assessment.
The analogy is worth taking seriously because it explains both the commercial pull and the behavioral consequences. Credit scoring did not merely let lenders price risk more finely; it created a shared, portable indicator that reshaped how borrowers behaved, because they could see and act on the same number their lenders used. A structural condition score has the same potential. When an owner, an insurer, and a reinsurer all reference the same SCI, the score becomes a coordinating mechanism: it prioritizes the owner’s maintenance, informs the insurer’s pricing and inspection, and feeds the reinsurer’s view of the assumed portfolio — while giving the owner a direct incentive to invest in resilience, because doing so visibly improves the score that determines their terms.
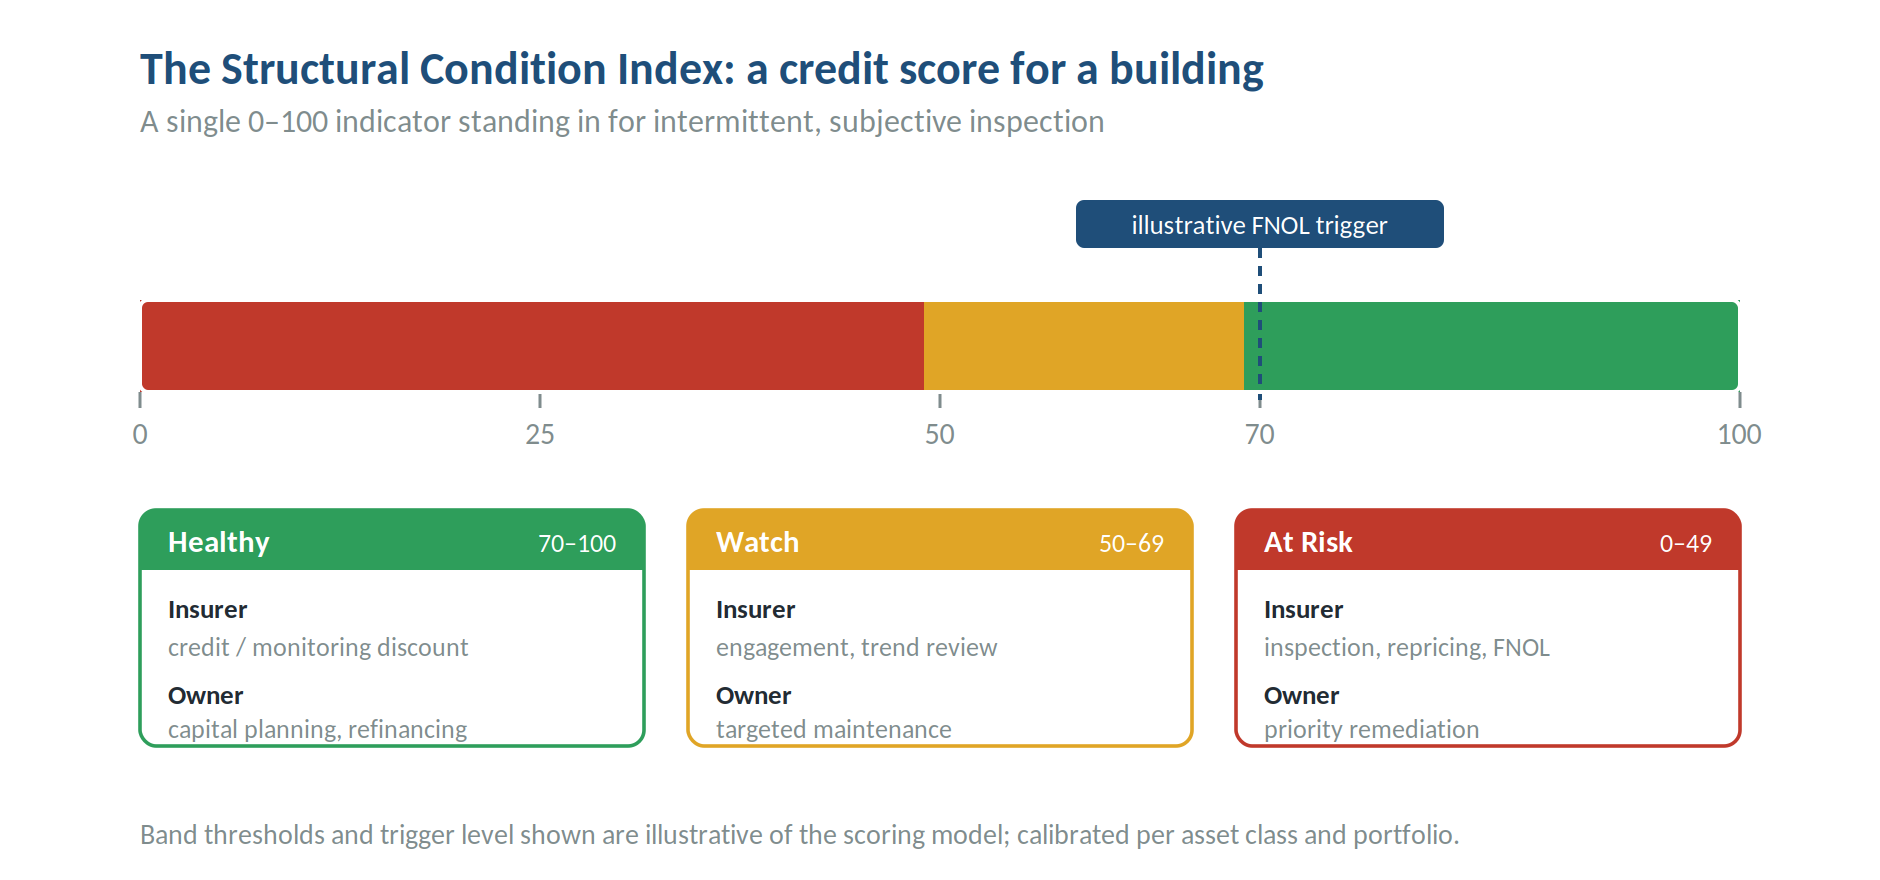
This closes the conceptual arc of the series. Paper 1 established infrastructure intelligence as a category and introduced the structural score as a credit-score equivalent; Paper 2 detailed the technical machinery — operational modal analysis, fatigue accumulation, anomaly detection — that produces a trustworthy score across the full diagnostic hierarchy from detection through prognosis. This paper completes the loop by showing what the score does once it exists: it becomes an underwriting input, a portfolio-management instrument, a claims trigger, and a treaty-design variable. The credit score for a building is not a metaphor for a future capability; it is the operational form that continuous structural intelligence takes inside a financial institution.
Parametric Insurance and Automated Claims
The most novel product opportunity created by continuous structural data is parametric coverage triggered by verified structural response rather than by adjuster interpretation. In a conventional indemnity claim, the costly and contested questions are whether, when, and how much an insured event damaged a structure — questions resolved slowly through forensic inspection and frequently disputed. A structurally instrumented building can answer them directly: the monitoring system records the event, the edge layer verifies its intensity and the building’s response, and a post-event comparison of modal behavior against the pre-event baseline quantifies whether — and where — the structure’s condition changed.
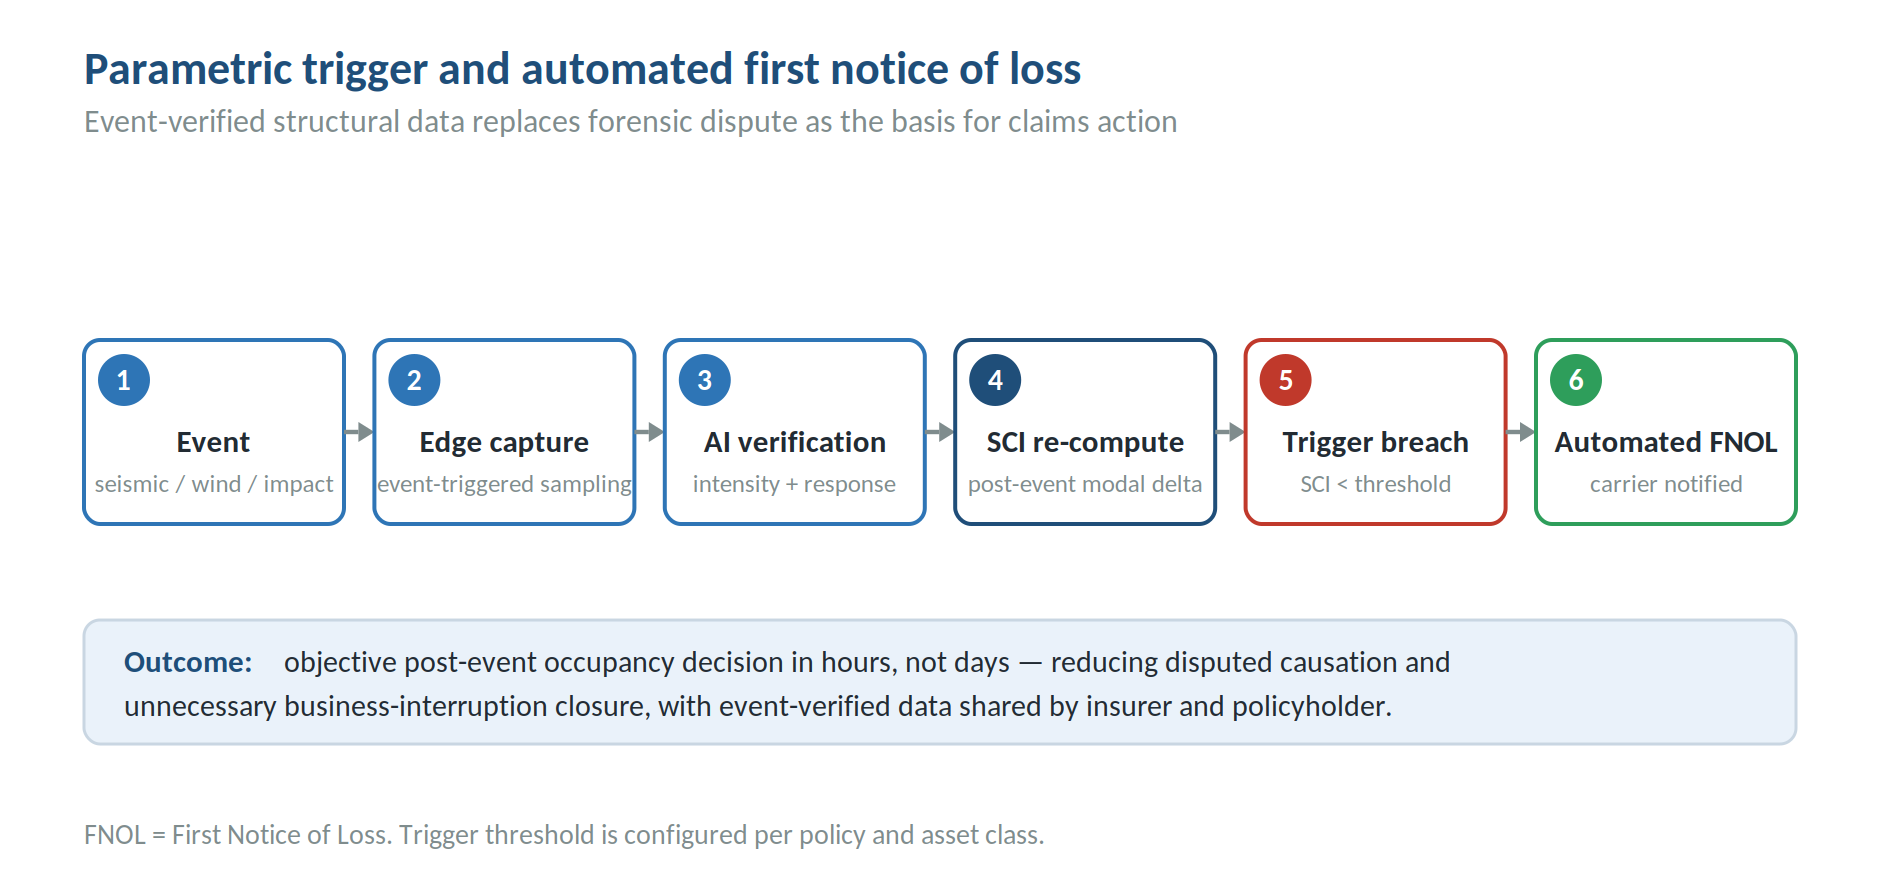
A credible trigger mechanism can be built on this. A policy can specify that a verified event combined with a defined deterioration in the Structural Condition Index — for example, the SCI falling below a contractually agreed threshold — automatically generates a first notice of loss and initiates a pre-agreed payment or occupancy workflow. Because the trigger rests on event-verified, time-stamped data that both parties can see, it compresses the claims timeline, reduces loss-adjustment expense, and largely removes disputes over causation and timing. The same data that proves a loss also disproves spurious ones, protecting the insurer as much as the policyholder.
The clearest near-term application is post-event occupancy. After a major earthquake, the binding constraint on recovery in a dense commercial market is the time it takes to determine which buildings are safe to re-enter — historically a manual, engineer-by-engineer process that took weeks following events such as the 1994 Northridge and 2011 Christchurch earthquakes. Continuous monitoring produces an objective post-event condition assessment within hours, allowing safe buildings to be re-occupied quickly and unsafe ones to be cordoned with confidence. Because business-interruption losses frequently exceed physical damage, and because much of that interruption cost is driven by precautionary closure rather than actual structural loss, compressing the occupancy decision is one of the highest-value levers continuous monitoring offers (consistent with Lloyd’s City Risk and resilience research on the economic cost of urban disruption).
Operational Continuity Economics
For the operators of mission-critical facilities — data centers, hospitals, utilities, and transportation infrastructure — the value of continuous structural intelligence is measured less in claim payments than in avoided downtime. In these environments, the cost of an unnecessary precautionary closure, or of an undetected structural problem that forces an unplanned outage, dwarfs the cost of monitoring by orders of magnitude. The same condition data that an insurer uses for pricing becomes, for the operator, an uptime-assurance instrument.
This alignment of interests is what makes continuous monitoring commercially durable. The owner gains operational resilience and a maintenance-prioritization signal; the insurer gains a better-managed risk and a lower expected loss; and a managed-service delivery model lets both benefit without the owner taking on capital cost or IT burden. Where these interests are formalized — for example, through monitoring offered as a value-added feature of coverage or as a condition of preferential terms — the insurer effectively converts a portion of its loss-prevention spend into a retention and differentiation advantage.
Operational resilience is also increasingly a governance expectation rather than an operational nicety. Asset-management and risk-management frameworks such as ISO 55000 and ISO 31000 treat the systematic, evidence-based management of physical-asset risk as a core discipline, and standards for the assessment of existing structures and for structural reliability (ISO 13822, ISO 2394) point toward condition-based, data-informed evaluation. Continuous structural intelligence operationalizes these frameworks: it supplies the objective, auditable evidence base that asset-management and resilience standards assume but that periodic inspection struggles to provide.
Reinsurance Implications
The implications of structural-condition data do not stop at the primary layer. Reinsurance steps in precisely when losses run well above trend, which means reinsurers carry disproportionate exposure to the peak-peril years that Swiss Re warns will land on an ever-larger asset base. For reinsurers, the quality of the ceded portfolio’s underlying asset data is therefore a direct input to treaty pricing and capital allocation.
This creates a cedant-differentiation opportunity. A primary carrier that can demonstrate, with portfolio-level structural-condition analytics, that its book is concentrated in measurably resilient assets — and that it actively manages the At Risk tail — presents a materially better risk to a reinsurer than one relying on construction-class averages. Over time, structural-condition data may become a basis on which treaty terms differentiate between cedants, much as catastrophe-model quality and data granularity already do. The cedant that brings better asset data to the renewal should, in principle, command better terms.
Structural-condition data also improves catastrophe reserve modeling on both sides of the relationship. Reserves are set against a loss distribution that is itself a function of assumed asset fragility; replacing assumed fragility with measured response for the monitored portion of a book tightens that distribution and reduces the uncertainty load. The effect is most pronounced for seismic-exposed portfolios, where the difference between a building’s code-class fragility and its measured, as-built behavior can be large — and where, as in Japan, a substantial share of corporate earthquake risk is ceded onward.
The cedant that brings better asset data to the renewal should, in principle, command better terms — making structural-condition analytics a competitive instrument at the treaty table, not only at the policy desk.
ESG and Infrastructure Lifecycle Extension
Continuous structural intelligence intersects directly with the environmental and governance pressures now bearing on real-estate owners and their lenders. The most carbon-intensive moment in a building’s life is its construction and, ultimately, its demolition and replacement. Extending the safe, serviceable life of an existing structure through condition-based maintenance is therefore not only a cost decision but a decarbonization one — avoided premature replacement is avoided embodied carbon.
Structural-condition data gives owners an auditable basis for lifecycle-extension decisions and for the resilience disclosures that investors and regulators increasingly expect. Rather than asserting that a portfolio is well-maintained, an owner can evidence it: a distribution of structural condition scores, trended over time, with documented intervention on assets that drift toward the Watch band. For insurers, this dovetails with portfolio analytics — the same stratification that informs pricing also supports the resilience narrative that capital providers and rating agencies are beginning to scrutinize.
The governance dimension is reinforced by the standards landscape. Building-information and asset-management frameworks (ISO 19650, ISO 55000) increasingly assume a living, data-backed model of the asset through its operational life; continuous monitoring is what keeps such a model synchronized with physical reality rather than frozen at handover. As resilience reporting matures from voluntary to expected, the organizations that already hold objective condition data will be positioned to comply at low marginal cost.
Regulatory and Investor Pressure
Adoption of structural monitoring is likely to be pulled forward less by mandate than by economics, but the regulatory direction of travel reinforces the case. In high-seismicity jurisdictions — notably parts of Japan and California — policymakers have begun to discuss condition-monitoring requirements for certain building categories, and post-disaster recovery programs increasingly value the rapid, objective occupancy assessment that instrumentation enables. Where such requirements materialize, they convert a competitive advantage into a baseline expectation, rewarding early movers who have already built the capability.
Investor and lender pressure may prove the stronger force. Capital providers exposed to commercial real estate are increasingly attentive to physical-risk resilience, and a portfolio that can evidence structural condition — and demonstrate active management of its At Risk tail — presents a lower and better-understood risk than one that cannot. As physical-risk disclosure frameworks mature, objective structural-condition data shifts from a differentiator to a documentation requirement, and the cost of not having it rises accordingly.
For insurers, the regulatory and investor environment is therefore an accelerant rather than an obstacle. The same data that improves underwriting economics also satisfies an emerging set of external expectations around resilience and disclosure, which means the investment can be justified on multiple grounds simultaneously — a combination that tends to move capital-allocation decisions inside large institutions.
Near-Term Insurance Innovation Opportunities
The practical entry point for most carriers is a focused pilot rather than a portfolio-wide commitment. The economics and the low installation burden of minimal-sensor monitoring make it feasible to test the underwriting and claims value of structural-condition data on a controlled segment of the book before scaling.
- Select a portfolio segment where condition data has obvious leverage — high-catastrophe-zone assets, aging structures with known vulnerabilities, high-value accounts warranting extra attention, or buildings with thin underwriting data where monitoring would reveal otherwise unobservable condition.
- Instrument those buildings with the minimal-sensor, managed-service model — typically 3–5 wireless sensors per building and a cellular gateway — requiring no client IT integration and minimal tenant disruption.
- Run the pilot for 12–18 months so that AI baselines stabilize and the program captures at least some weather or minor seismic activity against which to test event detection and post-event assessment.
- Define success criteria up front — accuracy of condition assessment versus engineering inspection, time saved in post-event occupancy decisions, loss-adjustment-expense reduction, or pricing refinement on monitored accounts — and involve underwriters, risk engineers, and claims staff in reviewing outputs throughout.
Three product structures are mature enough to test in parallel with the pilot. The first is monitoring-as-a-value-added-feature, bundled with coverage to strengthen retention on strategic accounts. The second is condition-informed pricing, applying preferential terms to accounts demonstrating measured resilience. The third is the parametric occupancy or structural-trigger product described earlier, initially offered as an endorsement on instrumented accounts in seismic-exposed markets. Each can be evaluated on its own success criteria, and each builds the proprietary data asset that makes the next step more valuable.
Mid-Term Industry Transformation
Looking beyond the pilot horizon, the trajectory points toward structural-condition data becoming a standard underwriting input category rather than an experimental one. The pattern mirrors the adoption of telematics in auto and of connected-device data in home insurance: an early period in which objective, continuous data is a differentiator for innovators, followed by a phase in which its absence becomes a competitive and eventually a documentation disadvantage.
In that mid-term state, the commercial property book becomes a continuously scored portfolio. Pricing reflects measured condition; reserving draws on tightened, observation-based loss distributions; treaty design differentiates cedants on the structural quality of their assumed portfolios; and claims on instrumented assets resolve quickly and with little dispute because the event and its structural consequences are recorded as they happen. Risk engineering shifts decisively from calendar-based inspection to condition-based intervention, and the insurer’s relationship with the policyholder shifts from periodic transaction to continuous risk partnership.
None of this requires the insurer to become a technology company. The managed-service, integration-not-replacement model means the carrier consumes decision-ready intelligence through its existing systems while a specialist practitioner operates the sensing and analytics layer. What the carrier must decide is when to begin accumulating the data asset and building the workflows around it — because the institutions that move first will hold longer baselines, better-trained models, and more refined underwriting integration than those that wait for the capability to become standard.
Conclusion
Across this series, the argument has moved from concept to capability to consequence. Digital twins establish that infrastructure can be represented as a living, data-fed model; continuous structural health monitoring supplies the predictive intelligence that makes the model trustworthy; and this paper has traced the financial consequence — what changes for insurers, reinsurers, and operators when every insured structure carries a continuously updated condition score.
The conclusion is that continuous structural intelligence is poised to become a foundational layer of commercial property insurance and operational risk management, not a peripheral tool. It attacks the industry’s central informational weakness — pricing dynamic assets from static, intermittent data — with an objective, comparable, continuously updated signal. The loss-ratio leverage is material, the claims and occupancy economics are compelling, the reinsurance and reserving implications are direct, and the product innovation, particularly parametric structural triggers, is genuinely new.
The transition is already underway, and it is evolutionary: an additive intelligence layer, delivered as a managed service, integrating with the systems insurers already run, on a pilot path that evidences value before scale. The strategic question is not whether structural-condition data will enter the underwriting stack, but who will hold the longest and best baselines when it does. The organizations that begin building that data asset now — pricing, reserving, and designing treaties around measured structural condition — will shape the next era of commercial property risk. Those that continue to price the built environment from historical proxies will increasingly find themselves selecting the risks their data-driven competitors have already declined.
About StructureIQ
StructureIQ, Inc. is a structural intelligence company based in Champaign, Illinois. Its Sentinel AI platform and Xnode wireless sensor suite deliver continuous, AI-enabled structural health monitoring through a minimal-sensor, managed-service model — typically 3–5 wireless sensors per building — producing a normalized Structural Condition Index for commercial, infrastructure, and industrial assets. StructureIQ works with insurers, reinsurers, enterprise integrators, and infrastructure operators to embed continuous structural intelligence into underwriting, resilience, and asset-management workflows. The company is positioned as the practitioner deploying, in production, the category of infrastructure intelligence this series describes.
References
Swiss Re Institute. (2026). sigma 1/2026: Natural catastrophes in 2025 — the persistent rise of wildfire and storm risk. Zurich: Swiss Re.
Swiss Re Institute. (2025). sigma 1/2025: Natural catastrophes: insured losses on trend to USD 145 billion in 2025. Zurich: Swiss Re.
American Society of Civil Engineers. (2025). 2025 Report Card for America’s Infrastructure (overall grade C; Bridges C).
Moody’s RMS. (2024, January 12). Estimated insured losses from the Noto Peninsula, Japan earthquake: JPY 435–870 billion (USD 3–6 billion).
Verisk Extreme Event Solutions. (2024, January 8). Industry insured-loss estimate for the Noto Peninsula earthquake: JPY 260–480 billion (USD 1.8–3.3 billion).
General Insurance Association of Japan. (2024). Paid-claims tally, 2024 Noto Peninsula earthquake (reported via Insurance Business Asia and Center for Disaster Philanthropy).
Nomura Research Institute. (2024). Economic loss estimate, 2024 Noto Peninsula earthquake; comparison with the 2011 Great East Japan (Tohoku) earthquake (JPY 16.9 trillion / ~USD 118 billion).
Lloyd’s of London. City Risk Index and urban resilience research on the economic cost of business interruption and disruption.
Munich Re. NatCatSERVICE annual natural-catastrophe loss data.
Federal Emergency Management Agency. (2020/2023). Building Codes Save: A Nationwide Study on Hazard-Resistant Building Codes. Washington, D.C.: FEMA.
Rytter, A. (1993). Vibration-Based Inspection of Civil Engineering Structures (SHM diagnostic hierarchy, Levels 1–4). Aalborg University.
International Organization for Standardization. ISO 55000 (Asset Management); ISO 31000 (Risk Management); ISO 2394 (Structural Reliability); ISO 13822 (Assessment of Existing Structures); ISO 16587 (Condition Monitoring of Structures); ISO 19650 (BIM and Information Management).
This document is intended for corporate advisory purposes and should be treated as confidential business information. Figures attributed to third-party sources should be verified against the most current primary releases prior to external distribution.